
 For a company with revenue in the millions of Euros, there are almost always new sources of growth available, provided it is willing to change its perspective on the market and redefine its business model. For a European group with revenue in the billions of Euros, the issue is different.
Jean Estin, President of Estin & Co, says for such groups it is difficult to find sources that can significantly impact the growth of the group outside of the prevailing trends that hold the key to growth for the decade. Their research has defined ten growth trends for these kinds of large European groups; in the article below he expands on the three most significant.
Emerging Markets
Emerging markets represent the most obvious and significant growth trend for Western groups who are already leaders in their domestic markets. Emerging markets are growing at eight per cent in value[1], representing 38 per cent of the current world economy, and are projected to represent 45 per cent in 2020, increasing to 50 per cent in 2025. Currently, they already contribute to 55 per cent of global growth, with China alone representing 30 per cent of this total.
With the other two related sources of growth—energy and raw materials, and international logistics—emerging markets contribute, directly or indirectly, more than two thirds of global growth.
The middle class of these countries is made up of 260 million people, and they possess ever-increasing purchasing power. This number in China and India alone is set to increase to 1.5 billion by 2020 and three billion by 2030 (compared to 450 million people in Europe and 340 million in North America, with very little projected growth). Historically, this will be the strongest large-scale development of the middle class that the world has witnessed. For mass consumer markets, as well as the manufacturing industries upstream of them, the future is undoubtedly Asia.
Taking the market for new car purchases as an example, the Chinese market is currently the largest worldwide; it is two times larger than the US market and will be three times larger by 2020. It represented only nine per cent of the global market ten years ago while today it constitutes 26 per cent—a growth 20 per cent growth. By 2020 it will be 34 per cent.
Out of the top 50 companies worldwide[2], with the highest TSR[3], in the last ten years, 18 companies come from emerging markets. They include Tencent, Baidu, Cnooc, Petrochina, Reliance, Banco do Brazil, China Life Insurance, Vale and Tata Consulting.
Louis Vuitton Moët Hennessy (LVMH), SAB Miller and Schneider Electric are all examples of Western groups who have developed more than 40 per cent of their revenue from emerging markets over the last ten years, with a staggering 80 per cent of their global growth being linked to these markets. For the same reason, numerous American, German, Scandinavian, Japanese and South Korean leaders in industrial equipment and construction machinery (Caterpillar, Komatsu, Terex etc) have realised strong growth driven by these emerging markets.
In the future, the global leaders will be mostly large Chinese or Indian groups, or the Western groups that have succeeded in developing leadership positions in these countries.
Innovation
Major revolutionary innovations are the second major sources of growth for next 10 years.
A large part of this is predicated on the digitalisation of the economy and the development of the internet.
Apple increased its revenue from USD 5 million to USD 157 billion between 2002 and 2012. Over the same period Qualcomm increased its revenue from USD 3 to USD 19 billion; Amazon from USD 4 to USD 61 billion; and Amgen from USD 6 to USD 17 billion. Strong growth potential remains in mature countries based on major disruptive innovations.
In Asia, in a similar way, innovative market leaders are emerging; Tencent (portal and internet services) increased from USD 0.04 billion to USD 7 billion; Baidu (search engine) increased from USD 0.01 billion to USD 4 billion USD; Huawei (telecommunication equipment) increased from USD 8 billion in 2006 to USD 35 billion; and Samsung (semi-conductors and electronic equipment) from USD 46 billion to USD 190 billion.
The innovations in media, mobile communications, computing, search engines, social networks, internet distribution, biotechnology, micro-electronics, that have profoundly changed their markets, represent roughly USD 4,500 billion of revenue in 2012, or six per cent of the world economy, with products and services that did not even exist ten years ago. They will contribute about 15 per cent of global growth in ten years.
Polarised consumers
Polarisation of consumers is a third source of growth, especially in mature countries.
Very high-end goods and services at one end of the spectrum and low cost goods and services at the other have developed to the detriment of the mid-range goods and services, which have stagnated and even decreased. This polarisation will continue and it will represent six per cent of global growth over the next decade.
A typical case is in aviation, where, over a 20-year period, the private jet business grew at 25 per cent per year, the low cost sector grew at 20 per cent per year and, between the two, the global market share of regular companies decreased from 95 per cent to 60 per cent. Another example is mobile telephones, where in 10 years smartphones have grown at 40 per cent per year, low price telephones have grown at 20 per cent per year, and the market share of middle range telephones has decreased from 95 per cent to 35 per cent.
This dynamic can be seen across all sectors and even includes financial services. The explosion of the middle classes in emerging countries is accompanied by an erosion (in percentage) of the middle classes—with a corresponding decrease in their purchasing power—in developed countries.
Three other sources—outsourcing of B2B services, the ageing population and, to a much lesser extent, sustainable development—together account for about eight per cent of global growth.
What to conclude?
In the last 10 years the 50 largest global groups[4], by TSR and growth, are all (with two exceptions) carried by one or two of these ten growth trends. This is illustrated in the table below:
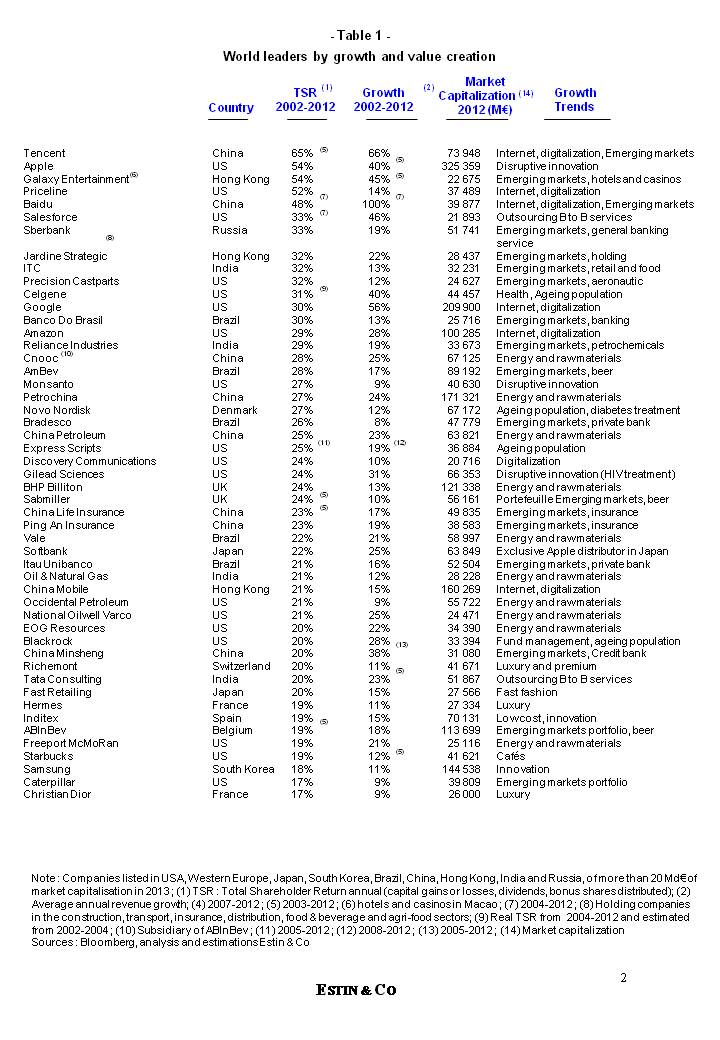
For these large groups, choosing the right mix of activities and geographic locations for their business portfolio has undoubtedly been more decisive than choosing the right or wrong competitive strategies within their existing activities and locations.
These trends constitute 63 per cent of the world economy today (avoiding double counting) and 98 per cent of its growth (see table 2):
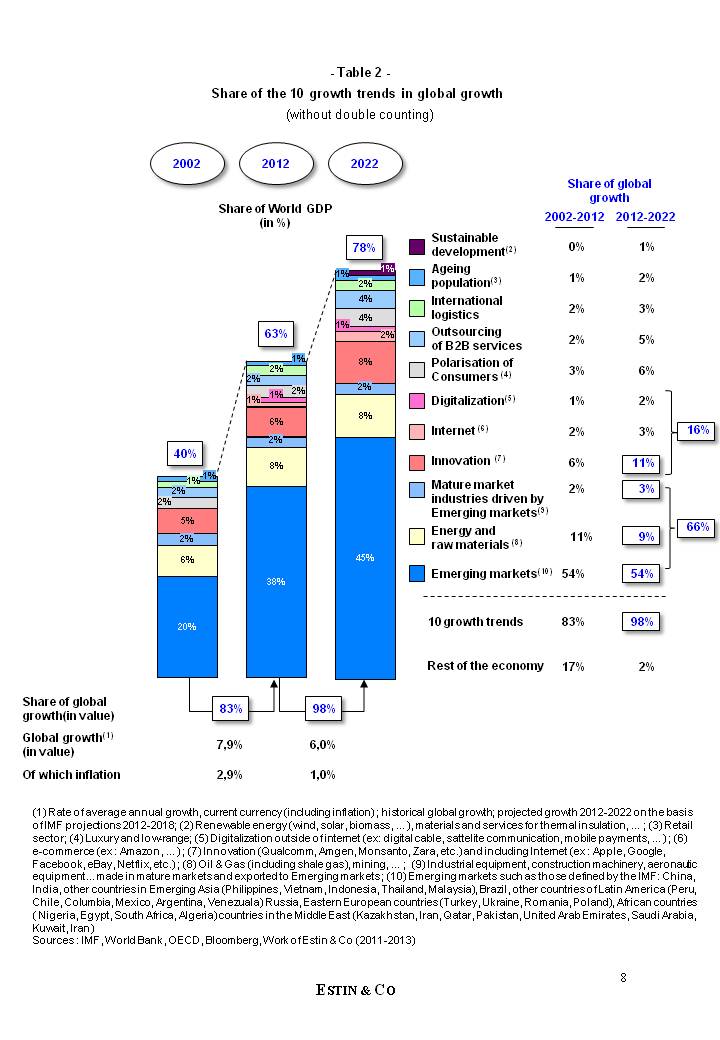
They will be at work for the next ten to fifteen years at least[5], with probable evolutions within each of them according to their actual variations and operating models. Emerging countries alone represent 55 to 60 per cent of this growth (by integrating the relevant part of the economy of mature markets that are directly driven by emerging countries[6]). Innovation, as well as energy and raw materials represent 20 per cent. These three main growth trends represent 80 per cent of future world growth.
For any major Western group, a few simple questions arise. Is the group driven by any of these trends? Is it sufficiently focused on this trend or trends, with relevant investments? If not, what should this group do to capture at least one of them?
This article is based on work done by our teams at Estin & Co during the period 2011-2013. It was written under the hypothesis of the continuation of free trade and globalisation of the economy.
Estin & Co is an international strategic consultancy firm based in Zürich, Paris, London, and Shanghai. The firm assists the boards of major European, North American and Asian groups in their growth strategies, and private equity funds in analysing and improving the value of their investments.
[1] Estimation of average future annual growth (2012-2018) by the IMF, in current currency.
[2] Market capitalisation of more than EUR 20 billion in 2012.
[3] Total Shareholder Return: the annual profitability of an investment, for its shareholders in terms of dividends, allocation of bonus shares, value of shares etc
[4] With a market capitalisation of at least EUR 20 billion in 2012.
[5] Provided that free trade and globalisation continue without major disruption such as war or world epidemics.
[6] Goods and industrial equipment made in Western countries for emerging countries, such as construction machinery, aeronautical products and industrial equipment.

Recent Comments