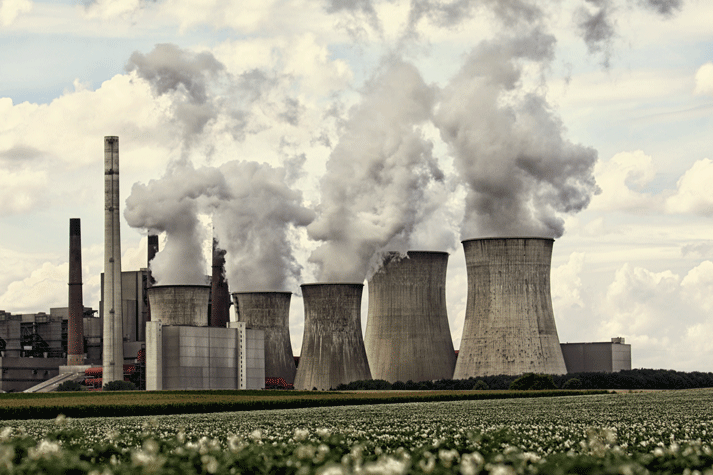
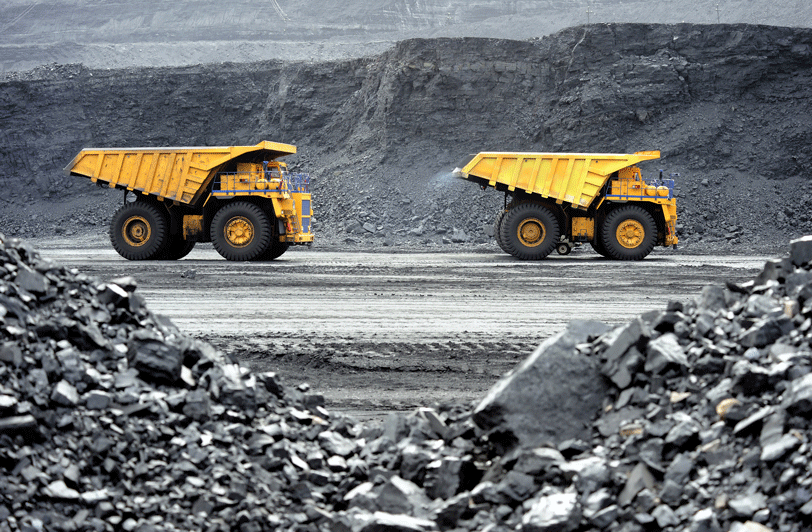
Beijing’s first ever pollution ‘red alert’ on 8th and 9th December, 2015, led many people, both in China and abroad, to assume that the air quality in China is deteriorating further. In fact, analysis of the first half of 2015 saw an overall improvement but media focus on the alert led to China’s air quality taking yet another very public kicking, nonetheless. Calvin Quek, head of Greenpeace’s Sustainable Finance Programme, looks at the reasons behind the improvement and how an increase in obsolete capacity in the coal power industry has resulted.
 Breathing a little more easily
Analysis of data gathered from the first half of 2015, corroborated an observation that Greenpeace had previously made in one of our regular news updates: China’s air quality generally improved during 2015. Although it is difficult to make out a discernible pattern by analysing Beijing’s PM 2.5 levels since 2013, a comparison of the 30-day moving average appears to show that 2015’s first-half PM 2.5 levels are in fact lower than those in previous years.
We went further and analysed first-half 2015 data gathered from 358 cities[1] across China and made some interesting findings:
- Average PM 2.5 levels across the 358 cities was 53.8 µg/m3.
- For 189 cities, average PM 2.5 levels fell 16% year-on-year (YOY), from 68µg/m3 to 56.9 µg/m3.
- Beijing PM 2.5 levels fell 15.5% YOY, from 92.1µg/m3 to 77.8µg/m3; Shanghai PM 2.5 levels increased 1.6% YOY, from 56.1 µg/m3 to 57.0 µg/m3.
- Biggest increases: Zhengzhou (Henan) rose 21%; Jiaozuo (Henan), rose 19%.
- Biggest decreases: Baoji (Shaanxi) fell 44.1%; Xian (Shaanxi) fell 40.7%.
It is worth noting that our analysis at Greenpeace—as reported by Bloomberg Business Week in August last year[2]—suggests that China’s weather conditions have not been the main contributing factor to the increase of clearer skies. Instead, the most likely main causes are:
- more policies being released that are aimed at dealing with air pollution, coupled with increased pressure to comply with them;
- more importance being placed on the need for China to change its energy mix; and
- secular and structural changes in China’s consumption of energy.
While the first two recall China’s National Air Pollution Plan (2013–2017) and its National Energy Plan (2014–2020), the latter points to strong trends that are taking shape independently of these aforementioned policies.
Energy statistics
So what were these secular trends? Below are some of the relevant data from China’s first-half 2015 electricity statistics:[3]
- Total electricity consumption rose 1.3% YOY, the lowest growth in four years, compared to 2014 (grew 5.3%), 2013 (grew 5.5%), and 2012 (grew 5.1%).
- By sector, industrial consumption of electricity (70% of consumption) fell 0.5% YOY, in contrast to consumption of services (grew 8.1%), households (grew 4.8%), and agriculture (grew 0.9%).
- Total electricity generation fell 0.6% YOY.
- By sector, thermal power generation (65% of generation) fell 3.2% YOY, mainly displaced by hydro (grew 13.3%), nuclear (grew 34.8%), and wind (see below)

Source: http://news.bjx.com.cn/html/20150723/645070-5.shtml. Data sourced from China Electricity Council and compiled by Greenpeace.
Taken together, China’s changing electricity generation and consumption patterns provide further evidence that the economy is diversifying. However, although China’s energy consumption growth is slowing and its economy is becoming more energy efficient, the thermal sector has not yet adjusted to this new reality and this is resulting in the formation of a ‘coal power bubble’.
What’s behind the bubble?
So what is this coal power bubble? Simply put, China’s coal power base is expanding far faster than demand for coal power generation. In 2014, thermal power capacity maintained its strong growth, up 6.4 per cent YOY, compared to 2013 (up 5.3 per cent), and 2012 (up 7.8 per cent). This trend continued in the first half of 2015, when capacity increased by 23.4 gigawatts (GW) (2.6 per cent YTD), the largest since 2012.
In 2014, thermal power generation decreased (down 1.6 per cent), and this continued in the first half of 2015. As a result, both thermal power operating hours and capacity utilisation rates have collapsed. This fall in utilisation was seen nationwide, with the exception of Jiangxi, Hainan and Hunan.
China’s energy consumption continued to slow in October 2015. According to the latest industrial production statistics released on 11th November, 2015,[4] thermal power generation (65 per cent of generation) in October fell 6.6 per cent YOY, which corresponded with weakness seen in China’s energy-intensive heavy industrial sectors (coal, cement, glass and steel all down 9.4, 3.5, 9.6 and 0.2 per cent YOY, respectively). However, despite a drop in thermal power generation, thermal power assets continued to increase, as power companies expanded capacity.
According to a Reuters report on 6th November,[5] the China Electricity Council said that there was a boom in coal power plant construction, which had increased 55 per cent YOY in the first half of 2015. Exactly how many projects have been approved this year, though? Where are they located, what are the underlying causes for this trend and what are the financial implications?
Diving deeper into the bubble
By analysing Environmental Impact Assessment (EIA) applications and approvals from the central and provincial Ministry of Environmental Protection (MEP) websites, Greenpeace found that from January–September 2015, 155 coal-fired power plants with a total capacity of 123GW had been approved, far exceeding the number and capacity approved in previous years.
| 2012 | 2013 | 2014 | 2015 | |
| Number of coal plants approved | 33 | 41 | 56 | 155 |
| Capacity of coal plants approved (GW) | 35.0 | 50.0 | 63.8 | 123.0 |
Source: Greenpeace analysis of MEP data, http://www.greenpeace.org/eastasia/publications/reports/climate-energy/climate-energy-2015/doubling-down/
Most of the projects are located in the key control areas, and in the central areas of the country. By province, Shanxi had both the most plants (24) and the largest capacity (21.3GW) approved in 2015. Xinjiang, came second in terms of capacity approved.
There are several reasons that explain this large increase in coal power plant approvals in 2015.
First, the increase is linked to the State Council’s 2013 ‘reduce government, delegate authority’ (简政放权) initiative, which aimed to reduce red tape and bureaucracy by devolving central level project approval authority to the provinces. Between 2013 and 2015, the central National Energy Administration, the National Development and Reform Commission (NDRC) and the MEP began to allow their provincial counterparts to directly approve coal power projects. This was a contentious development: on the one hand, it was well received by the power sector, which wanted to expand capacity quickly; on the other, it was criticised by various environmental lawyers and officials, who believed that the sector would expand irrationally with reduced oversight.
Second, the number of coal power plants grew as Chinese mining companies, decimated by years of falling coal prices, started to diversify into the power generation business and either set up joint ventures with established power companies or went into the business by themselves. According to Bloomberg analysis, driven by huge margin differentials (mining: 11 per cent versus power: 42 per cent), mining companies boosted their power capacity to 140 GW, a 17 per cent gain over the past two years.
 One example of this mining-to-power diversification trend is the company Shenhua, the world’s largest coal company, which started to increase investment in the power business in 2011. In 2014, Shenhua’s gross profits from its power business grew to 41 per cent from 23 per cent in 2012, while coal mining profits fell from 75 per cent to 56 per cent over the same period.
However, despite Shenhua’s apparent success in diversifying its revenue streams, other companies may not find the path as smooth. As indicated above, average coal power plant utilisation rates across the country fell steadily in 2015, and unless there is commensurate de-commissioning of outdated capacity plant developers may be digging a bigger financial hole for themselves as electricity demand growth slows in China.
Investors should be wary: Greenpeace’s study found that of the 123 projects approved in 2015, listed independent power producers (IPPs) accounted for 61 of the 123 approved projects and 49 per cent of approved capacity.
Ultimately though, the financial consequences of these underutilised coal plant assets may not completely fall on the companies, given that there is an implicit guarantee that provincial governments will bail out unprofitable state-owned company projects. At the same time, power plant utilisation rates is only one of several other factors (such as power tariffs, interest rates and input costs) that determine profits and shareholder value. Thus, even as utilisation rates have fallen precipitously, the share prices of China’s IPPs were all generally flat in second half of 2015.
There is still an economic cost to be reckoned with over the long term, though: the lost potential of putting these financial resources into more productive sectors of China’s economy, and the structural costs of labour markets (workers not being retrained, new jobs not being created in alternative sectors) not reforming to meet evolving market needs.
In view of this, China’s coal power bubble is perhaps the proverbial ‘canary in the coal mine’ – a warning of what might happen when corporate and planning developments are out of sync with broader trends. As China struggles with bad investments in other sectors as well, policy-makers might do well to avoid recreating other sector bubbles in their bid to maintain GDP growth. And for investors looking for where to park their money, all eyes should be on whether Chinese policy-makers offer prudent long-term policies (cue the 13th Five-Year Plan) to China’s changing economic dynamics.
Calvin Quek heads the Sustainable Finance Programme at Greenpeace in Beijing. This article was adapted from issues 21 and 22 of their regular report Dark Clouds.
[1] Currently, there is data for 358 cities across China. In 2014, only 189 cities’ data was available. Hence comparisons between 2013/2014 could only be done for 189 cities
[2] Larson, Christina, China Gets a Little More Fresh Air, Bloomberg Businessweek, 7th August, 2015, viewed 10th December, 2015, <www.bloomberg.com/news/articles/2015-08-06/pollution-china-gets-a-little-more-fresh-air>
[3] National Energy Statistics, National Energy Administration, 15th July, 2015, viewed 10th December, 2015, <http://www.nea.gov.cn/2015-07/15/c_134414315.htm>
[4] Industrial Production Operation in October 2015, National Bureau of Statistics of China, 11th November, 2015, viewed 11th December, 2015, <http://www.stats.gov.cn/english/PressRelease/201511/t20151111_1271430.html>
[5] China should stop adding new coal-fired power plants – state researchers, Reuters, 6th November, 2015, viewed, 11th December, 2015, <http://uk.reuters.com/article/2015/11/06/china-coal-electricity-idUKL3N1311O920151106>


Recent Comments